1. Theoretical basis
1.1. What is radar?
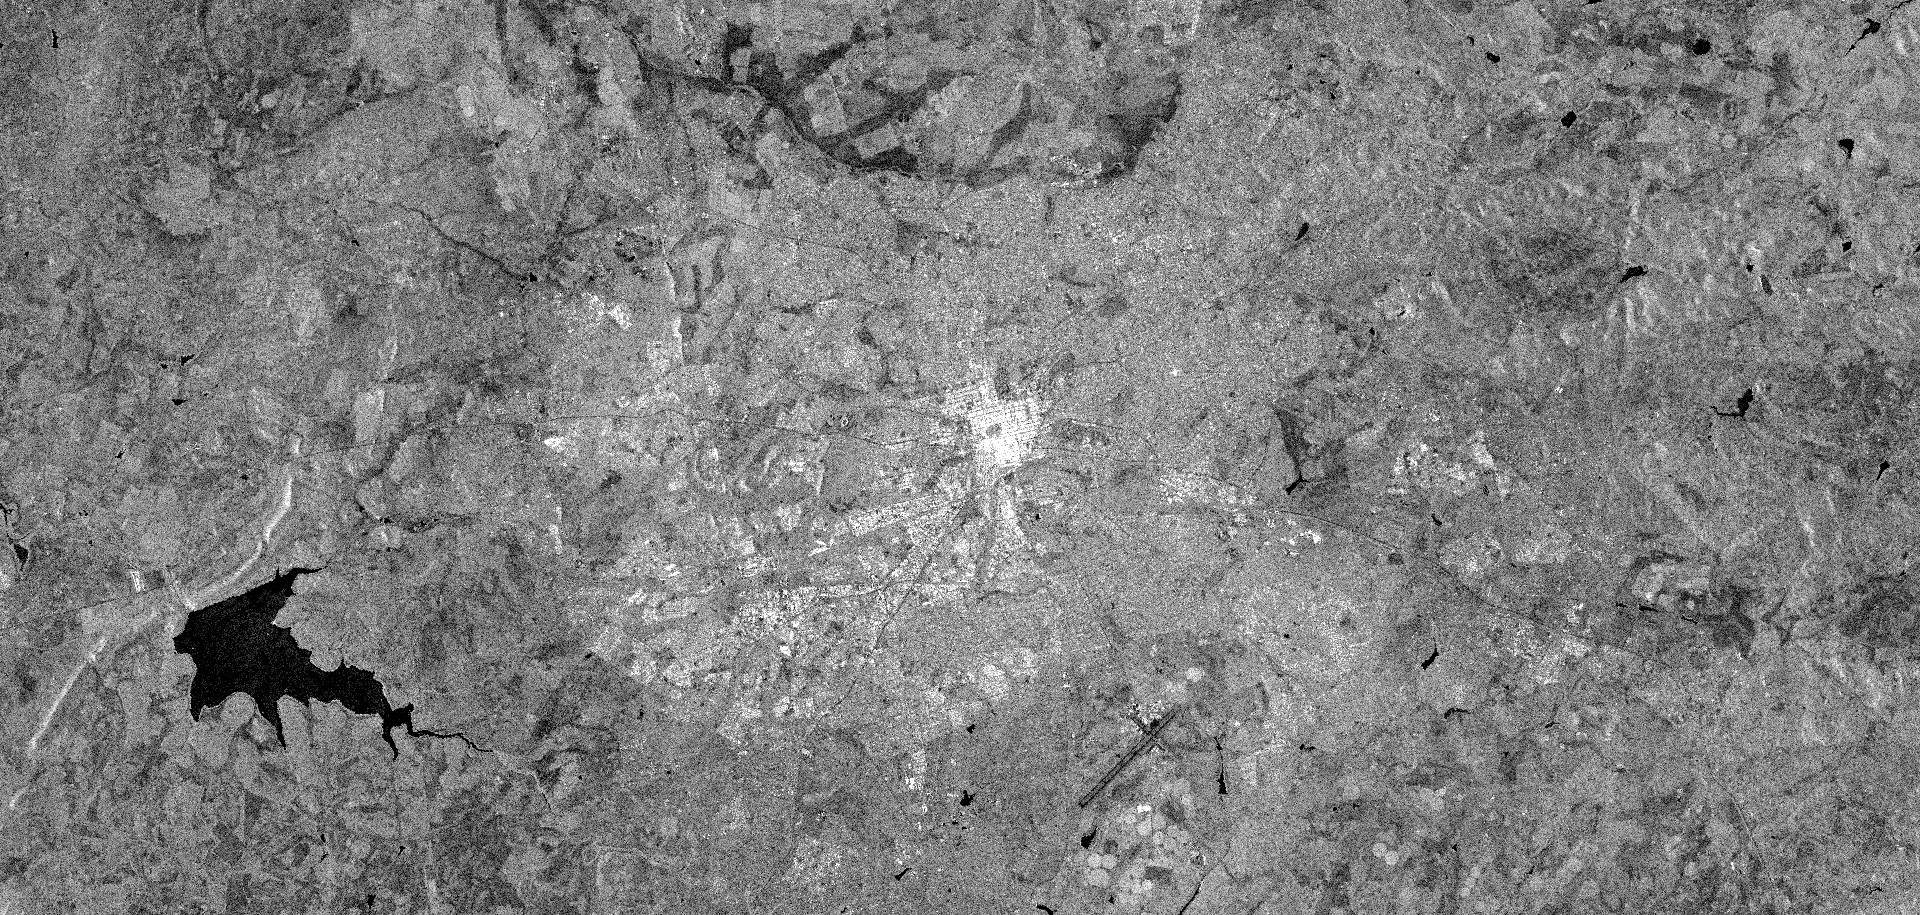
RAdio Detection And Ranging (radar) operates by transmitting a microwave signal (with wavelength from 1 centimetre to several meters) towards a target and measuring the returned radiation (backscatter). Synthetic aperture radar (SAR) instruments use a satellite to generate images of large areas at high resolution. Radar imaging is not affected by cloud cover, and as radar instruments provide their own energy source they can operate at day or night. The magnitude of backscatter recorded by a SAR instrument is influenced by properties of the transmitted radiation, such as its wavelength, polarisation (orientation), and incidence angle, and the properties of the reflecting surface, such as its geometric structure, surface roughness and water content, and the interaction between the transmitted radiation and surface properties.
For example, this is a radar image from the Sentinel-1 satellite of Harare:
1.2. Mapping biomass with L-band radar
Radar satellites are active sensors that look obliquely at the Earth’s surface using microwave data (in the mm –cm wavelength range). The microwave radiation generated by radar instruments can penetrate through the forest canopy to obtain information on forest structure, with the amount of radiation scattered back to theinstrument (‘backscatter’) increasing as the number and/or size of trees present in an area increases. Therefore radar satellites have been used to map aboveground biomass, and to map changes in biomass.
Measurement of aboveground biomass with radar is limited by a saturation point, typically round 150 tonnes per hectare aboveground biomass for L-band (the longest, and therefore most sensitive, wavelength currently available), and ~50 tonnes per hectare for C-band (which is more widely available). The saturation point of L-band radar is higher than is typically reached by vegetation in southern Africa (including Zimbabwe), making it a powerful means of quantifying aboveground biomass.
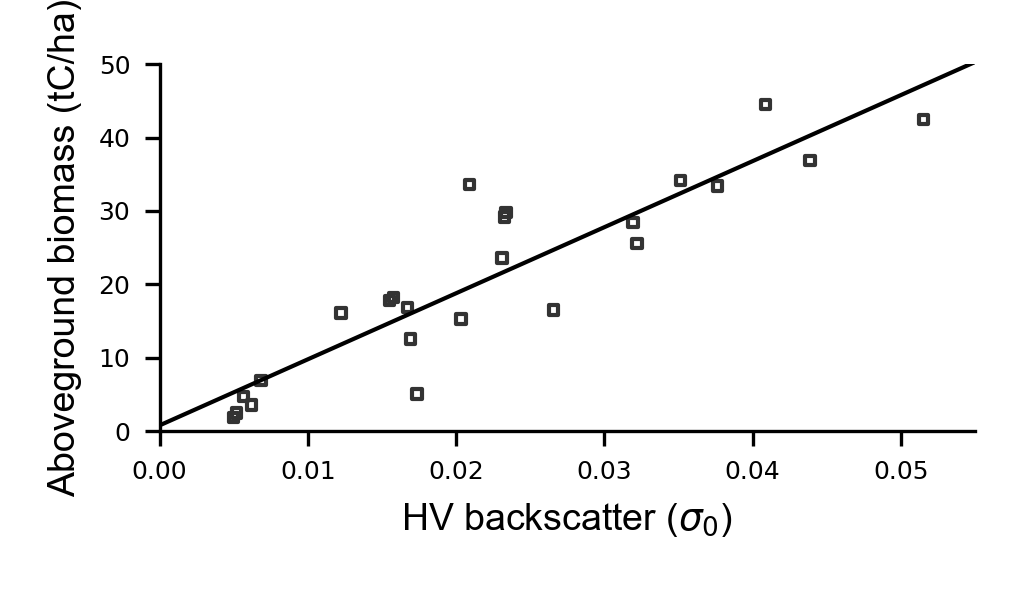
The relationship between L-band backscatter and aboveground biomass can be determined by calibrating radar backscatter using points of known aboveground biomass, such as forest inventory plots. For example, the following calibration function was generated using plot inventory data and backscatter from L-band radar in southeastern Tanzania:
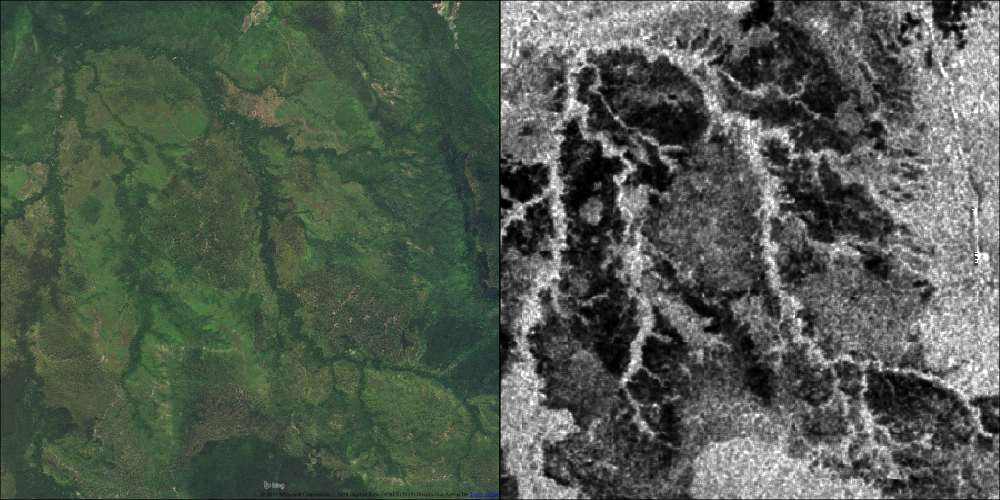
To see what this means in in practice, it helps to consider the problem visually. In the left image we see a high resolution image of an area of diverse vegetation cover in the same regon of southeastern Tanzania, and on the right the same area as measured with a radar instrument known as ALOS PALSAR. Greater backscatter is indicated by whiter colours, showing a clear distinction between open grasslands and agriculture, woodlands, and denser forests:
1.3. Change detection with L-band radar
By comparing biomass maps from two time periods, it’s possible to use repeated radar data to detect changes. For instance, it has been used to map changes in biomass over miombo woodland in Mozambique, showing areas of increasing (blue) and decreasing (red) biomass with high accuracy:
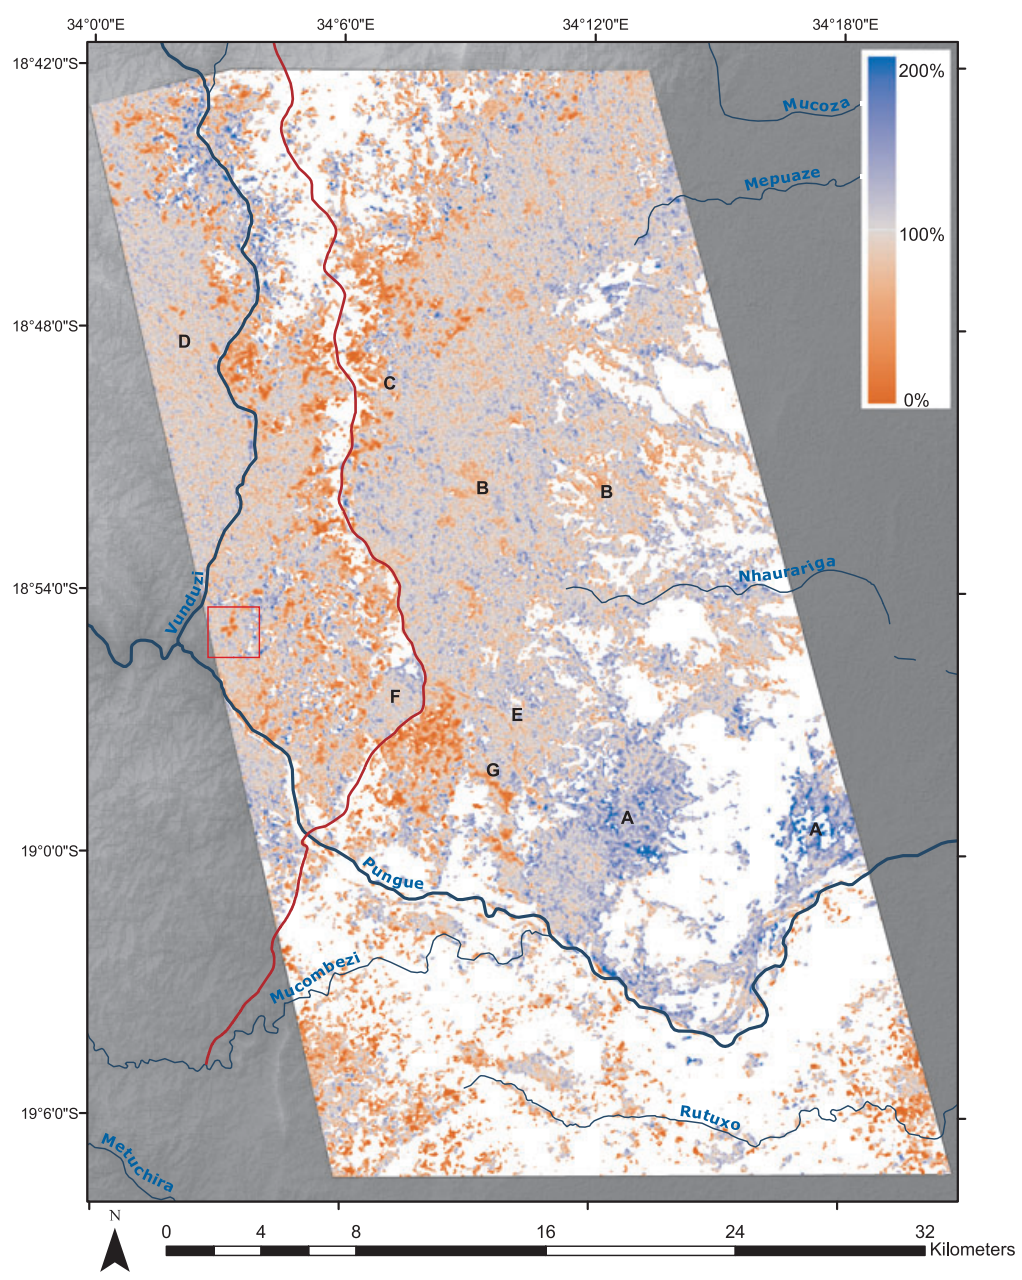
Change detection in this manner is not problem-free. Radar backscatter is also sensitive to vegetation and soil moisture changes, so a change in radar backscatter can also result from rainfall or flooding. Further to this, radar data usually appear very noisy (due an affect known as radar speckle), which results in random increases or decreases in radar backscatter that are unrelated to changes in vegetation structure. Together, this means that radar imagery need to be carefully processed in order to produce reliable change maps.
1.4. Further reading
For further reading, see the following scientific publications:
- Ryan, Casey M., et al. “Quantifying small‐scale deforestation and forest degradation in African woodlands using radar imagery.” Global Change Biology 18.1 (2012): 243-257.
- McNicol, Iain M., Casey M. Ryan, and Edward TA Mitchard. “Carbon losses from deforestation and widespread degradation offset by extensive growth in African Woodlands.” Nature communications 9.1 (2018): 3045.
- Mitchard, Edward TA, et al. “Using satellite radar backscatter to predict above‐ground woody biomass: A consistent relationship across four different African landscapes.” Geophysical Research Letters 36.23 (2009).
- Bouvet, Alexandre, et al. “An above-ground biomass map of African savannahs and woodlands at 25 m resolution derived from ALOS PALSAR.” Remote sensing of environment 206 (2018): 156-173.