6. What next?
6.1. More data: option A
We’ve brought along radar data covering all of southern Africa. Find a location that you’re familiar with, or an area in which you’re interested in, and build a biomass and biomass change map.
6.2. More data: option B
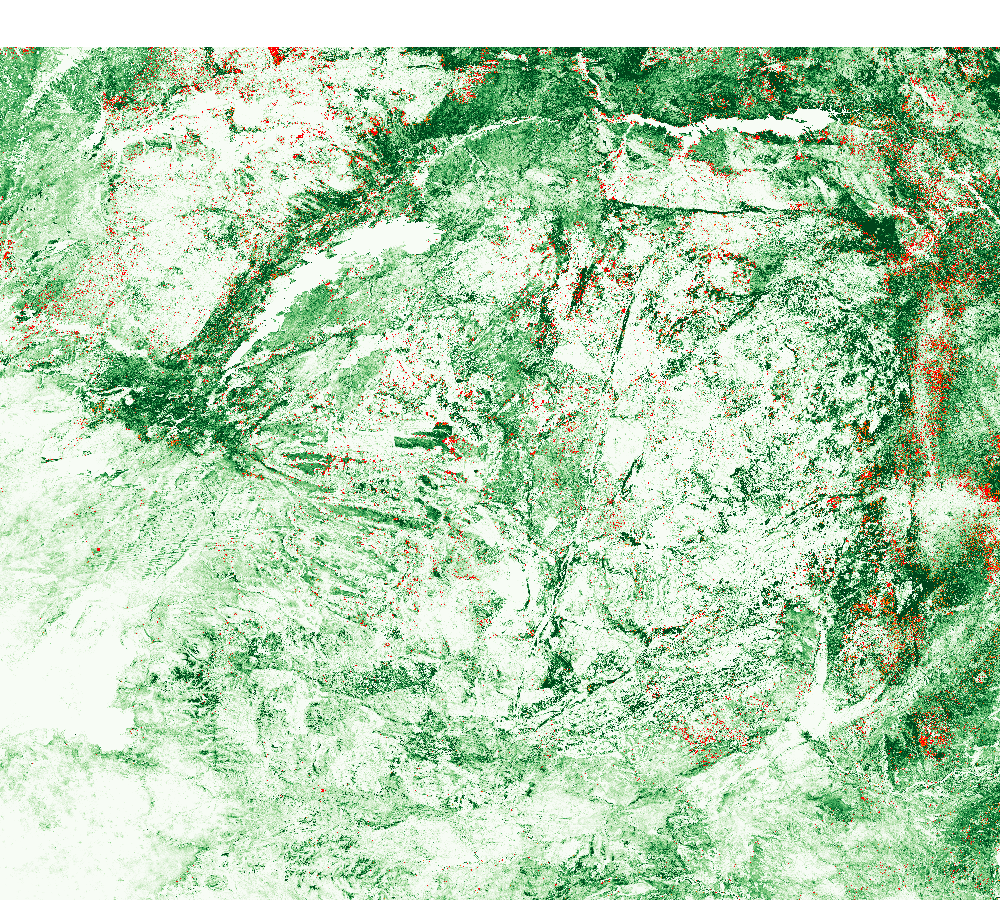
We’ve also brought along pre-calibrated biomass, biomass change, and classified deforestation/degradation maps from across Zimbabwe. With this data you can visualise the forest cover changes that have occurred over the past decade in Zimbabwe. Again, if you have an area in mind that you’d like to look at, we have the data with us.
6.3. More data: option C (very advanced!)
Download a shapefile covering the regions and districts of Zimbabwe (http://www.diva-gis.org/gdata). Using the data from option B, try to caclulate the deforesation rate for some shapefile polygons. Which regions have experienced the fastest rate of deforestation?